Perf and Heaptrack
2019-10-27Introduction
The last three years I worked mainly alone on converting the C++ code of an open source renderer to Rust:
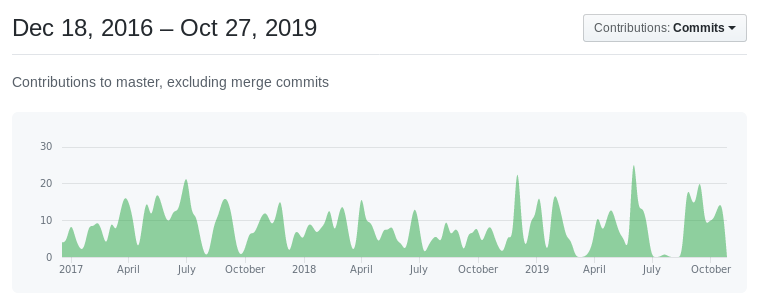
Most of the test scenes render 100% the same, which means that there is not a single pixel which is different between the resulting images rendered by the C++ version vs. the Rust version.
But the performance is different and I am going to change that. So far I tried to stay as close to the original C++ source code as I could, but I might have not chosen the wisest implementation for the Rust counterpart, simply because I was still learning the language during that time.
I need some powerful tools to measure performance and learn how to interpret the results. Let's start with some simple examples and document which tools I used and how you see the difference between two different versions of the renderer.
Heaptrack
Let's start with heaptrack and the difference between two commits, e6b7ae40 and e6214826:
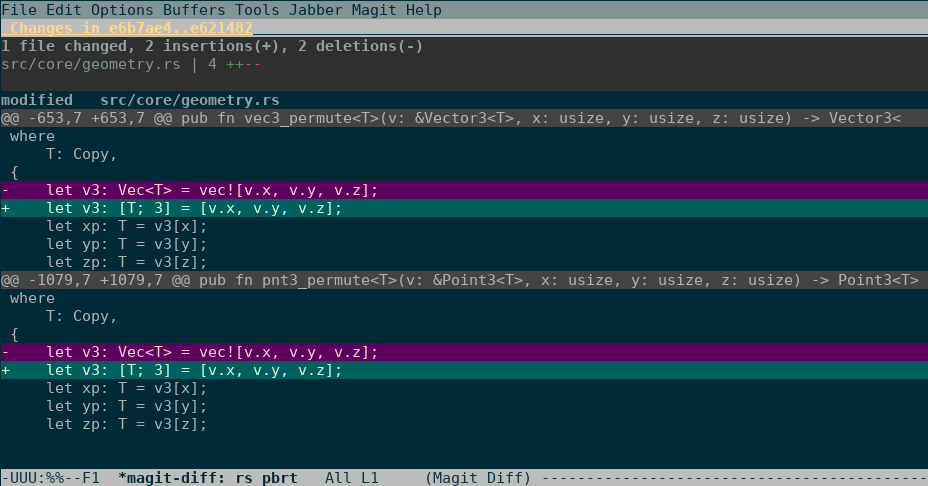
So, basically I was lazy or not really concentrated on the task when I
wrote the two functions vec3_permute<T>(...) and
pnt3_permute<T>(...). I used Vec<T> instead of an array with
three values of type T: [T; 3]. But can we see the difference with
heaptrack? So, let's first check out the old version and create some data:
# checkout commit e6b7ae40
> git checkout e6b7ae4085d4fe7c0925092c800436f5148f09b4
# compile rs_pbrt
> cargo test --release --no-default-features
# create heaptrack data by rendering example scene
> heaptrack ./target/release/rs_pbrt -i assets/scenes/cornell_box.pbrt
...
  heaptrack --analyze "/home/jan/git/github/rs_pbrt/heaptrack.rs_pbrt.8945.gz"
> mv heaptrack.rs_pbrt.8945.gz heaptrack.rs_pbrt.e6b7ae40.gz
> heaptrack_gui heaptrack.rs_pbrt.e6b7ae40.gz
Note: I used only one pixel sample so the renderer is fast:
> git diff assets/scenes/cornell_box.pbrt
diff --git a/assets/scenes/cornell_box.pbrt b/assets/scenes/cornell_box.pbrt
index aa3a210..5e26823 100644
--- a/assets/scenes/cornell_box.pbrt
+++ b/assets/scenes/cornell_box.pbrt
@@ -10,7 +10,7 @@ Film "image"
   "integer yresolution" [ 500 ]
 ##  "integer outlierrejection_k" [ 10 ]
 ##Sampler "sobol"
-Sampler "sobol" "integer pixelsamples" [8]
+Sampler "sobol" "integer pixelsamples" [1] # [8]
 ##PixelFilter "blackmanharris"
 ##SurfaceIntegrator "bidirectional"
 ##Integrator "directlighting" "integer maxdepth" [10]
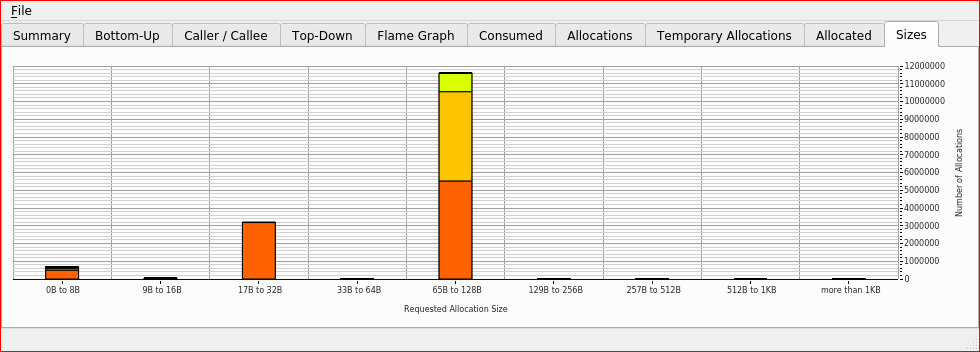
One of the resulting graphs shows the requested allocation (sizes):
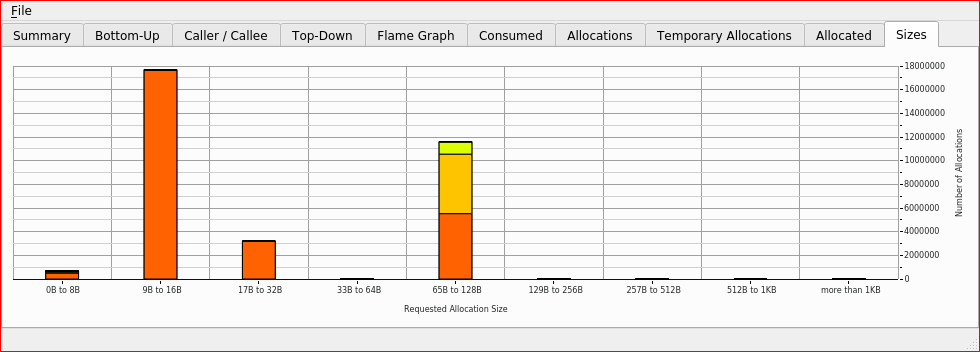
By placing the mouse over the second column you can confirm that those
allocations indeed come from vec3_permute. How does it look like
after the change to use an array?
# checkout commit e6214826
> git checkout e6214826c4ce7bd82eabc4573d12080ad0bdd2dc
# compile rs_pbrt
> cargo test --release --no-default-features
# create heaptrack data by rendering example scene
> heaptrack ./target/release/rs_pbrt -i assets/scenes/cornell_box.pbrt
...
  heaptrack --analyze "/home/jan/git/github/rs_pbrt/heaptrack.rs_pbrt.30739.gz"
> mv heaptrack.rs_pbrt.30739.gz heaptrack.rs_pbrt.e6214826.gz
> heaptrack_gui heaptrack.rs_pbrt.e6214826.gz
Now the second column is basically gone.
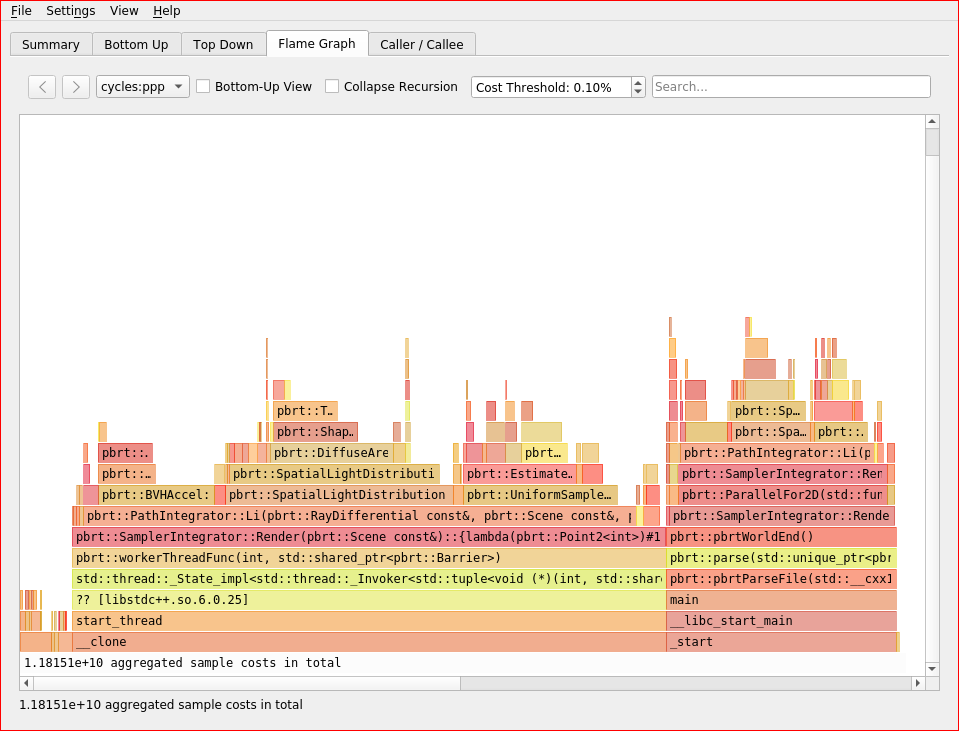
Placing both versions on top of each other and zooming into the
flame graphs shows that indeed the top version does not show the
entries for vec3_permute above the Triangle::intersect anymore:
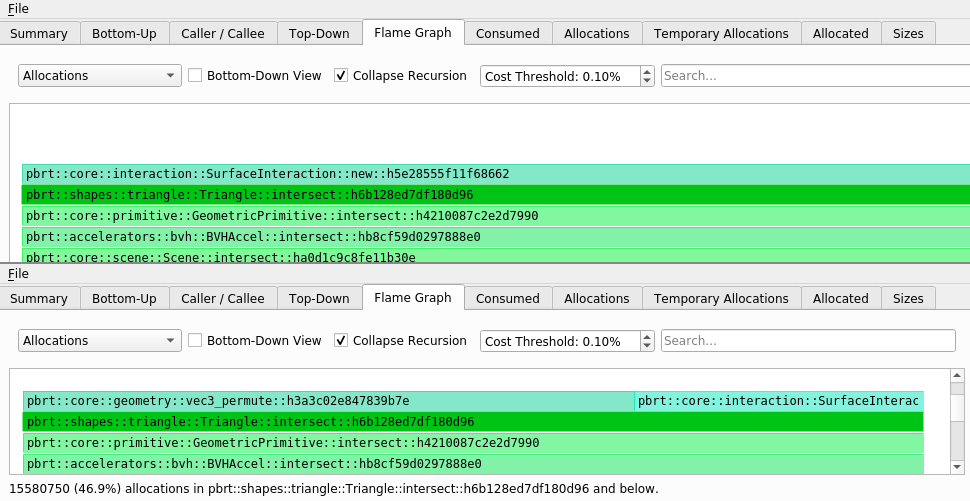
But, of course those allocations are not entirely gone. They just moved from the heap to the stack. Read more about the difference between stack and heap ...
Perf
Now let's look at the performance of both the C++ and the Rust version:
# Rust
> perf record --call-graph=dwarf ./target/release/rs_pbrt -i assets/scenes/cornell_box.pbrt
...
[ perf record: Woken up 914 times to write data ]
[ perf record: Captured and wrote 230.456 MB perf.data (29103 samples) ]
> mv perf.data perf.rs_pbrt.e6b7ae40.data
One way to look at the resulting data would be perf report (see
perf Examples):
> perf report -i perf.rs_pbrt.e6b7ae40.data
But a graphical view (via KDAB hotspot) would be nicer:
> ~/Downloads/hotspot-v1.2.0-x86_64.AppImage perf.rs_pbrt.e6b7ae40.data
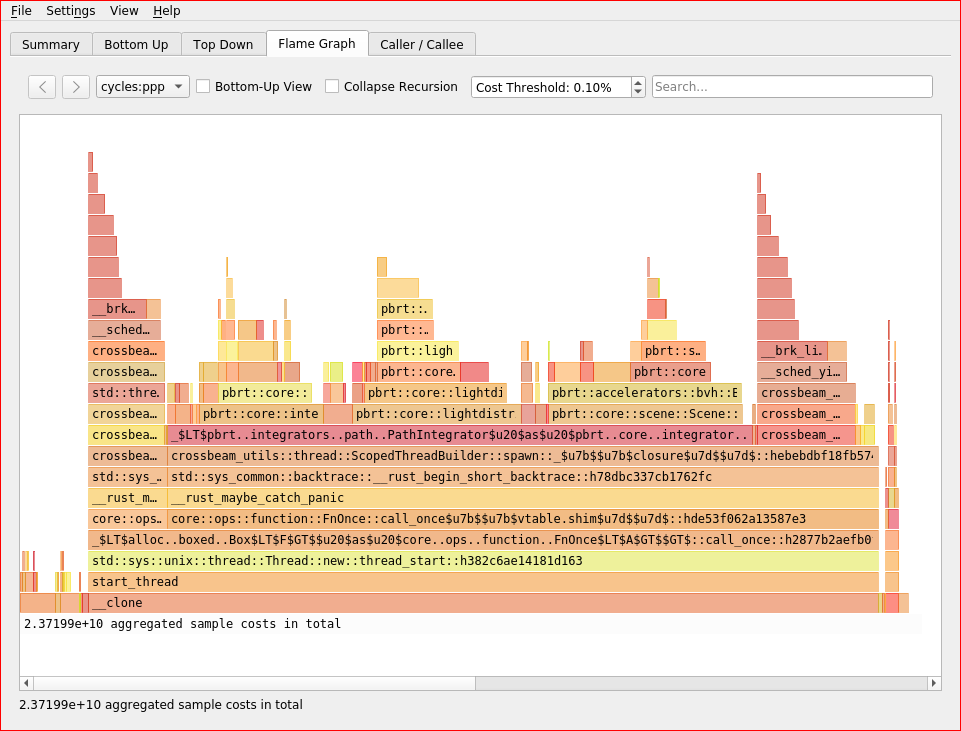
And now the C++ version:
# C++
> perf record --call-graph=dwarf ~/builds/pbrt/release/pbrt assets/scenes/cornell_box.pbrt
...
[ perf record: Woken up 464 times to write data ]
[ perf record: Captured and wrote 116.346 MB perf.data (14460 samples) ]
> mv perf.data perf.pbrt.data
> ~/Downloads/hotspot-v1.2.0-x86_64.AppImage perf.pbrt.data